Find out how to take action now!
Before anything else – we asked for support from an internal sponsor at senior level and requested backing from our founders. All good.
We formed a project team – we in effect became our own customer because another question we wanted to answer at the time was: “If we implement this for our customers what would the experience be like for them?” And: “How can we make it as easy as possible?” The BrightGREEN team of accredited experts came together.
Here are the steps you can take to measure your carbon footprint in Salesforce Net Zero Cloud.
This section will give you those all-important insights to help you manage your environmental impact.
Salesforce Net Zero Cloud is preloaded with reference data that enables calculations which conform to the Greenhouse Gas (GHG) Protocol. This means raw data from bills can be added into the platform and it will literally do the maths to produce carbon footprint records.
There are several ways to get your data into the system:
Time to gather utility bills and travel records to record energy consumption for assets (buildings and vehicles) and travel activities. Plus, decide on the reporting period.
This step encouraged us to consider our recording processes so that we set ourselves up for future success. This data is added to Energy Use records. A Carbon Footprint is a summary of Energy Use records.
Building Energy Intensity (BEI) is a useful metric because it lets you use automatically-calculated averages to fill any gaps in your data (with just one click per gap). That means you can start to compare buildings to manage down a benchmark metric.
How that works is: You specify the size of the building. The platform works out an average energy intensity based on Energy Use records for that building and location. You can then set KPIs and targets to manage future energy consumption per building and take actions to get the BEI number down. And that is a big thought – how can you look into the future and take action to make it a brighter one?
Further down the line we believe, with customisation, the platform could predict the building intensity of a new building even at planning stages, or a building you want to lease in future.
And the future is not that far away in this instance because Salesforce updates Net Zero Cloud with new functionality at least twice a year.
Salesforce developed Net Zero Cloud to measure its own carbon intensity and also works with the world’s leading companies to do the same. Salesforce uses that collective knowledge to enhance core Platform capabilities over time.
Essentially, we all benefit from a world-class dev team that is bringing new functionality to the Platform so everyone can use it. Certainly the power of AI is already available via Tableau CRM. We see that as an exciting option for modelling our future energy use, so that we can get everyone involved in using the greenest sources of energy we can.
Now that the data is in, you can calculate your carbon footprint, see it visualised on a Climate Action Dashboard, as well as run reports for your stakeholders. Part of the story is complete.
Categorise, visualise and account for the unique supply-chain emissions your company is indirectly responsible for.
This is where your implementation partner can help you set up records that are unique to your business or industry sector.
Once the relevant carbon factor has been matched with your Scope 3 emission item you can track with greatest precision.
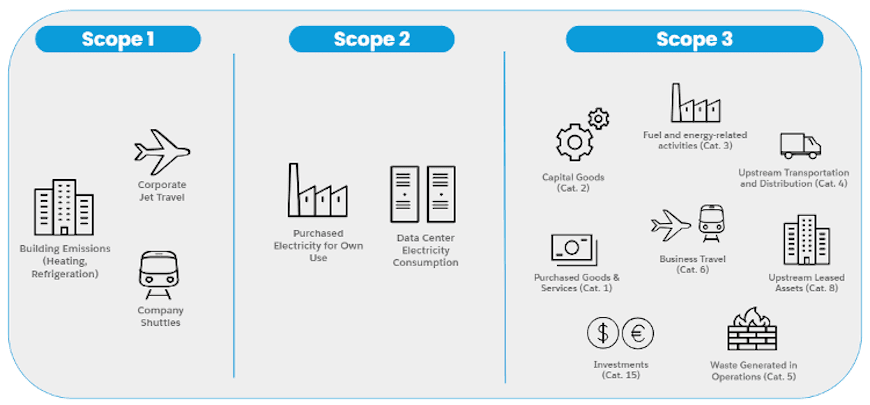
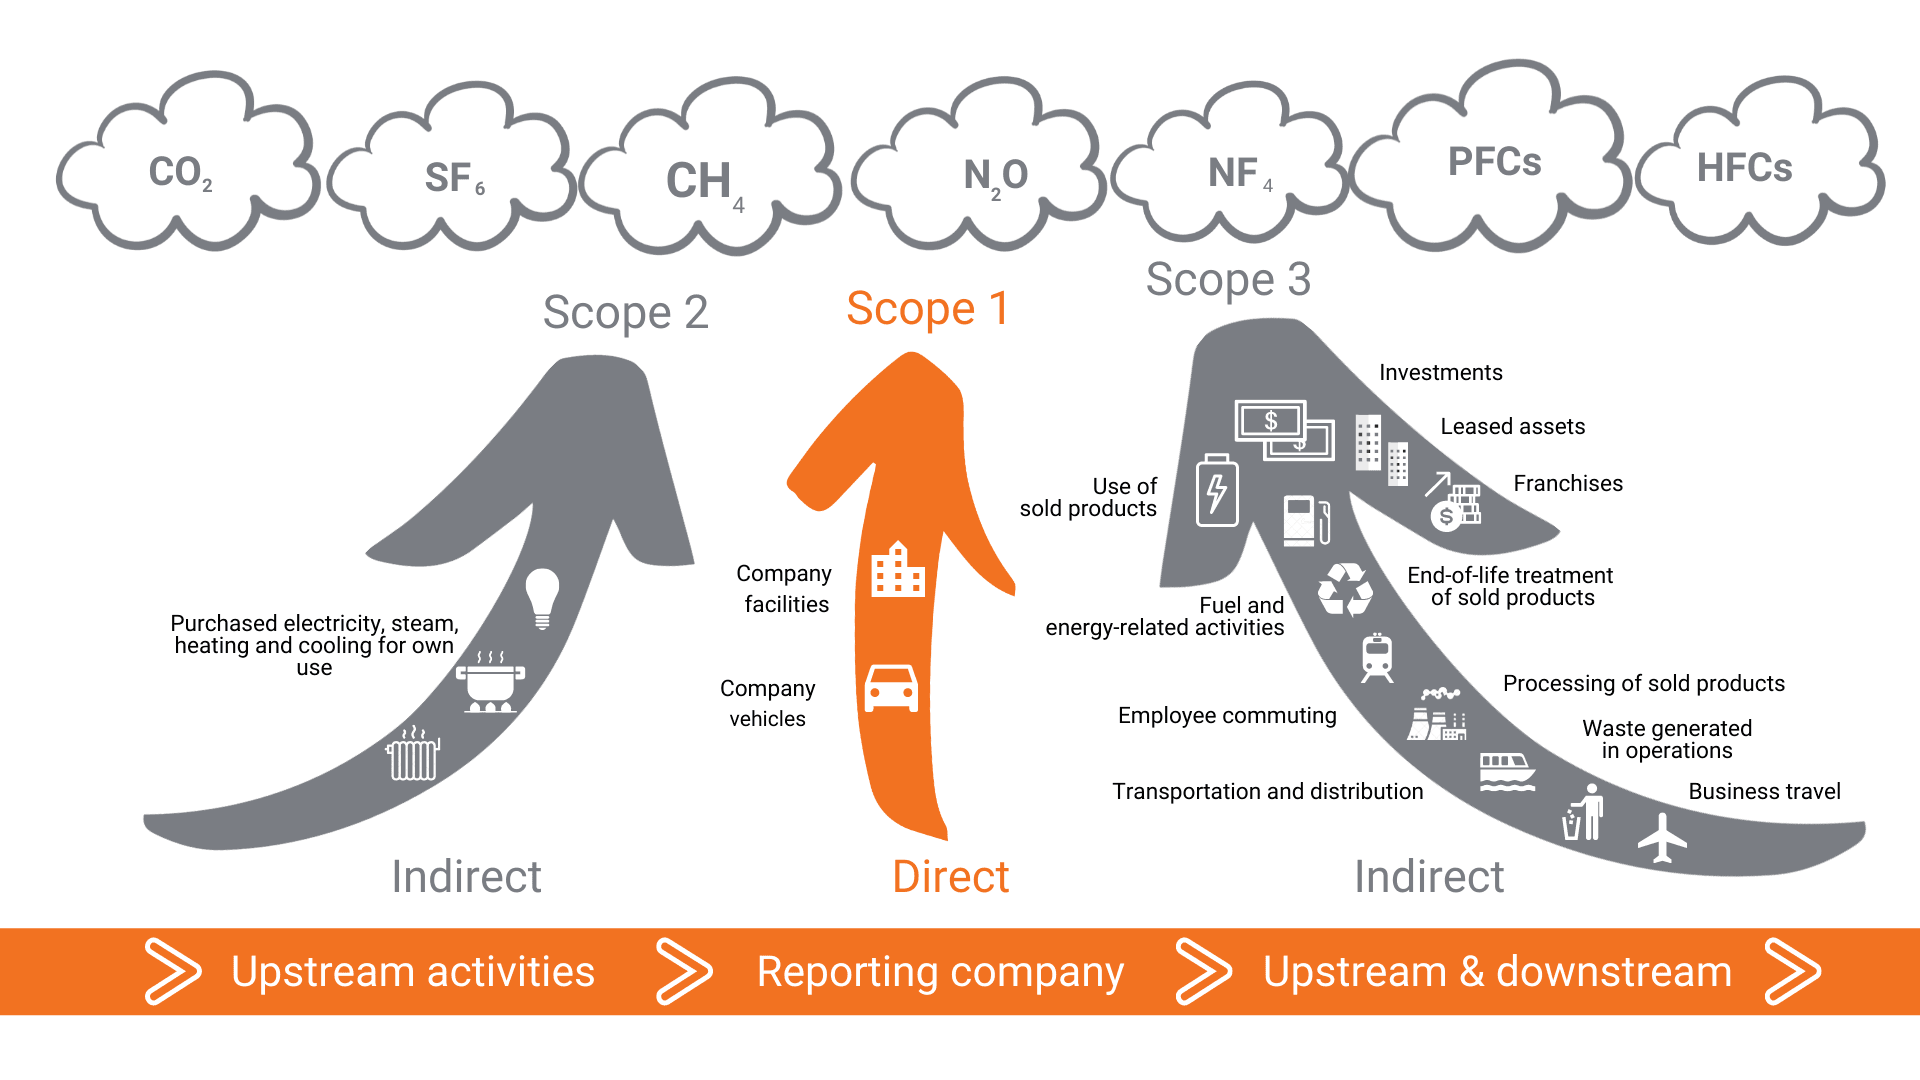
Remember: Scope 3 emissions are all indirect emissions (i.e. not included in Scope 2) that occur in your organisation’s value chain, including upstream and downstream emissions.
Salesforce gives examples of Scope 3 emissions, including:
Fast and simple to track — all a company needs is its procurement data. Net Zero Cloud provides a process of matching spending categories to spend-based emission factors and to Scope 3 categories. The results can be summarised by spend type and by vendor.
Net Zero Cloud comes with predefined stages that you can use while working through the process to complete carbon footprints. The stage is a required field on the Carbon Footprint record.
You can view the stage for an individual record on the path or on the Kanban view in the Carbon Footprint tab.
Your admin can modify the values in the stage field to meet your organisation’s needs.
The carbon accounting stages are included in the table on this page.
Asset Confirmation
The Sustainability Manager confirms whether to include an individual building or vehicle asset in the Carbon Footprint
Data Collection
Enter all Energy Consumption records; for example, monthly energy usage from utility bills
Data Gap Filling
For any missing energy consumption records, fill Energy Use data gaps using system estimates
Validation
Sustainability Manager determines the initial data looks correct
Renewable Energy Allocation
Renewable Energy Allocation information is added to the Energy Consumption records
Internal Audit
An internal auditor validates the Energy Consumption and Carbon Footprint information
External Audit
An external auditor validates the Carbon Footprint information
Finished
The validated Carbon Footprint record is complete
Tableau CRM gives you three pre-configured dashboards:
You can run dashboards manually to see a live snapshot, or automatically run them at intervals of your choosing.
Tableau CRM dashboards are an out-of-the-box feature of Sustainability Cloud and are pre-configured.
This means as soon as Energy Use Records have been added to the platform you can look at your total carbon footprint.
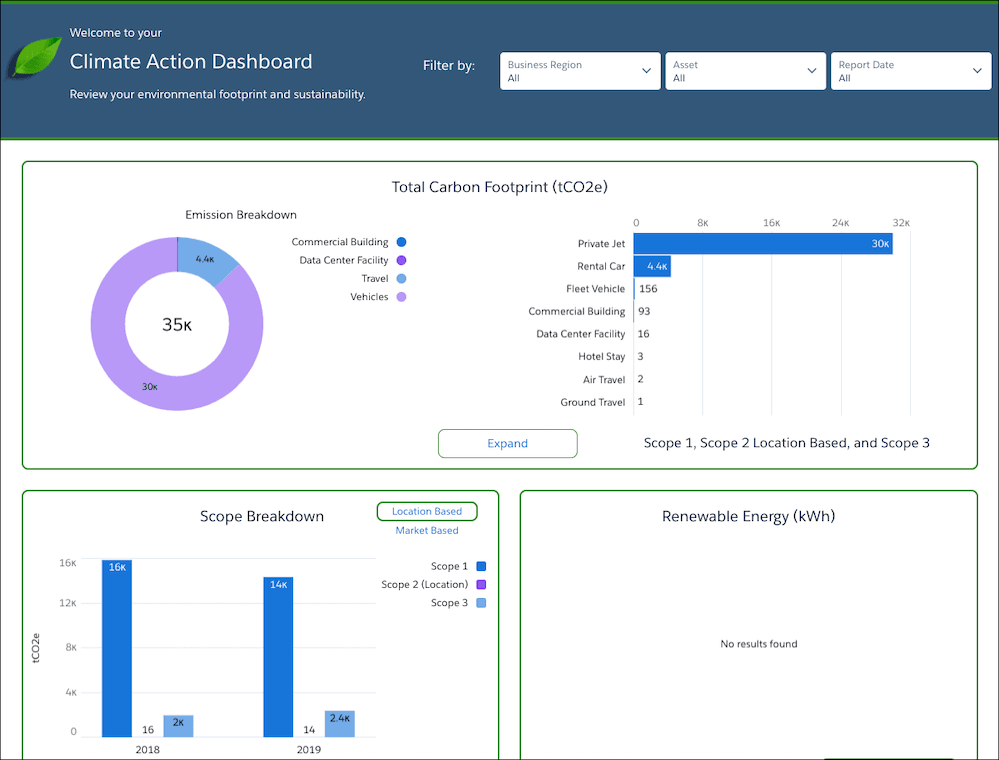
In the Climate Action dashboard, pages display data about your Carbon Footprint. Pages detail Energy Use, carbon intensity, and renewable energy data, by various metrics.
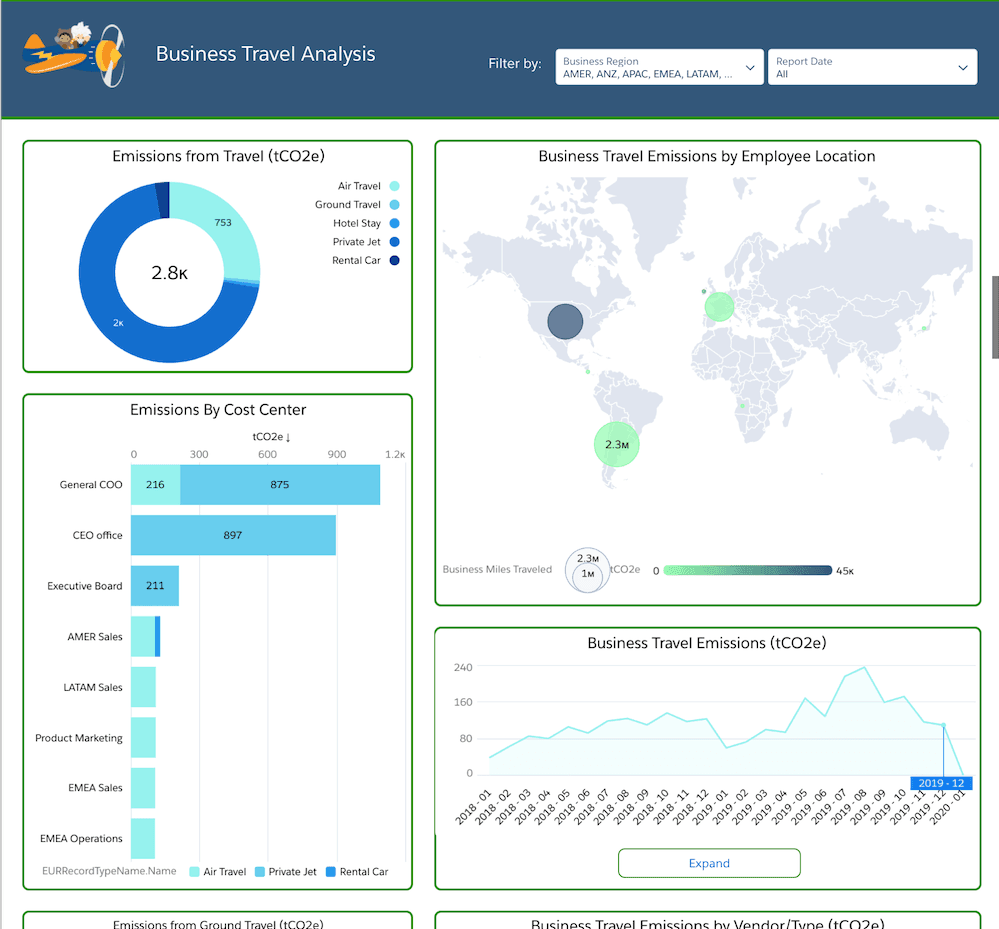
The Business Travel Impact dashboard shows the carbon footprint of your business travel Energy Use records.
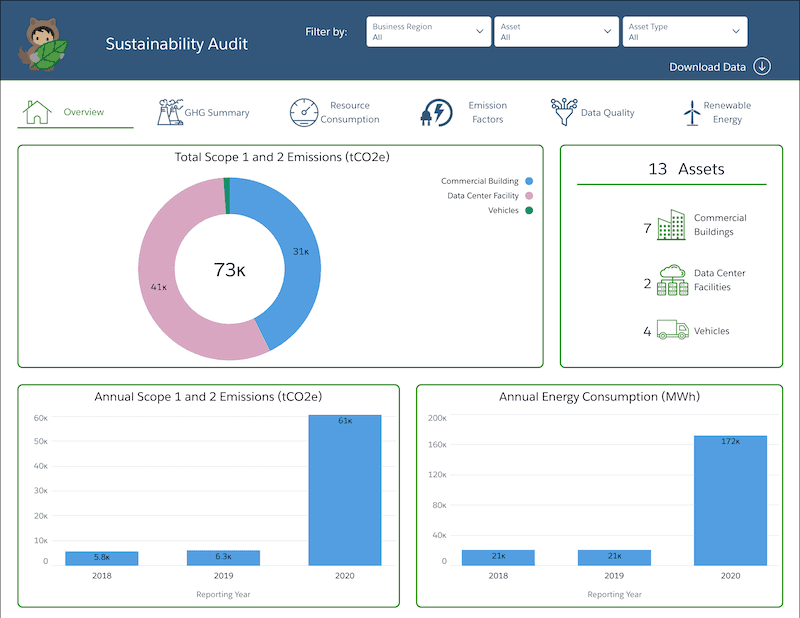
In the Sustainability Audit dashboard, you can view:
How you report your findings depends on the size and environmental impact of your organisation. You are now fully equipped to report to a government agency or in an annual report for shareholders and stakeholders.
With Net Zero Cloud, you have all the information and tools to determine your climate action strategy.
According to Salesforce, by this point:
After those steps you can import previous Carbon Accounting Data for your year-on-year graphs in Tableau. Or you can create Salesforce Reports to interrogate the data further to ask business questions.
At BrightGen, we built the platform internally within a few weeks to understand its capabilities for ourselves.
During this process we became convinced that our customers, other organisations and the environment can benefit too.
BrightGREEN is a quick start solution to help you start measuring your carbon footprint in weeks rather than months and get on the front foot.